Portfolio project · SQL + Python + Tableau · June 2026

Tesla FSD says 25% of the world has access. Only a third of that is real.

I audited Tesla Full Self-Driving's global rollout the way a regulator would: country approvals, rollout status, NHTSA investigation records, and the expansion pipeline — then quantified the gap between the headline and usable access.

Population in "approved" markets: 2.06BCan actually engage FSD: 639M · 31%
2.06B
Total population in "approved" countries
639M
Can actually use FSD today (31% of headline)
13
Countries with regulatory approval (2020–2026)
~30 days
Between EU approvals in 2026 (vs. 17 months: US→Canada)
17 pts
Of the 25% headline come from China's limited rollout
3.2M
US vehicles in NHTSA's Engineering Analysis (pre-recall step)
2.2B
Population in pipeline markets (India, Brazil, Japan, EU)
1.45B
India's population — no announced regulatory framework
Findings

What the data actually says

Approval is a network effect

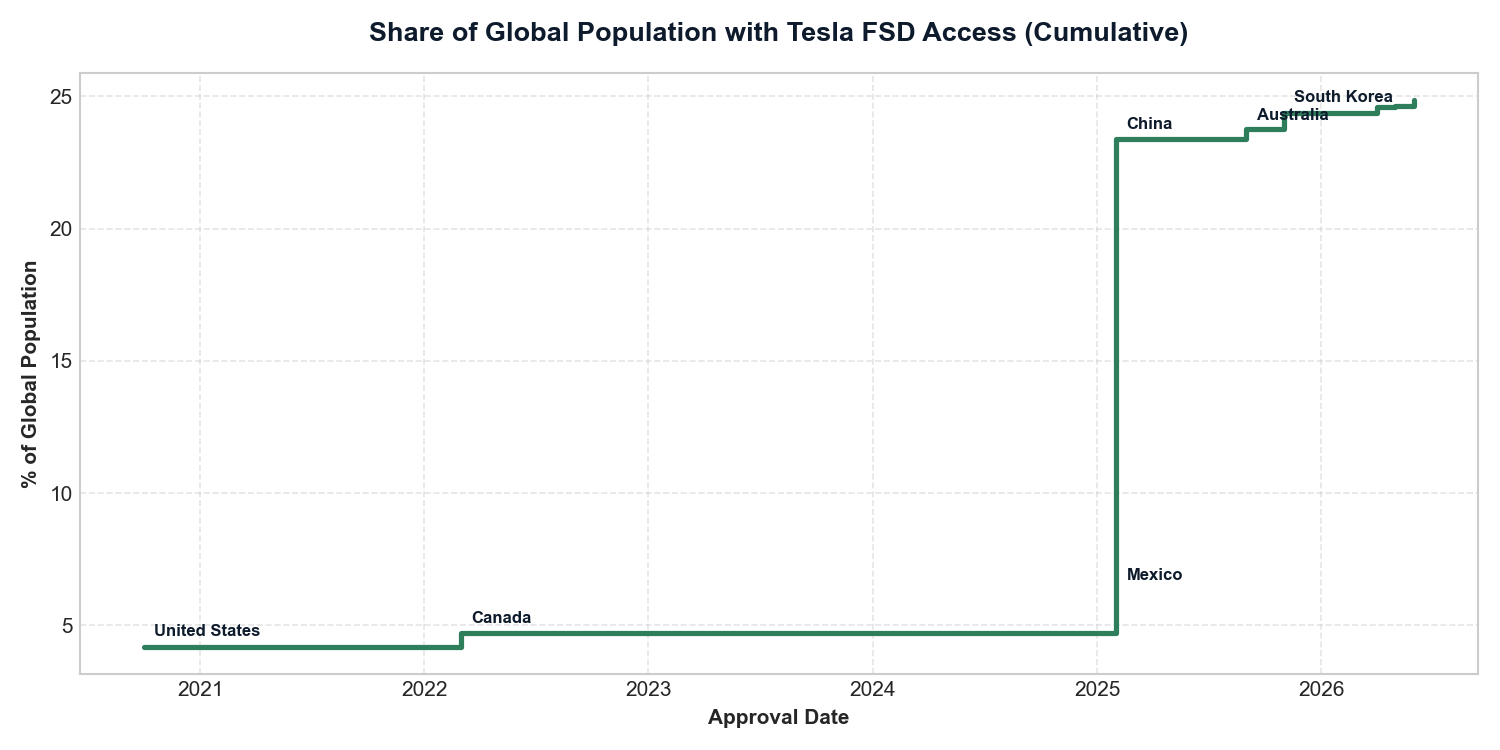
The Dutch RDW's April 2026 approval became a template other European regulators reuse — five EU countries approved FSD in roughly 60 days. Regulatory velocity, not software capability, is now the growth variable.

"Access" ≠ adoption

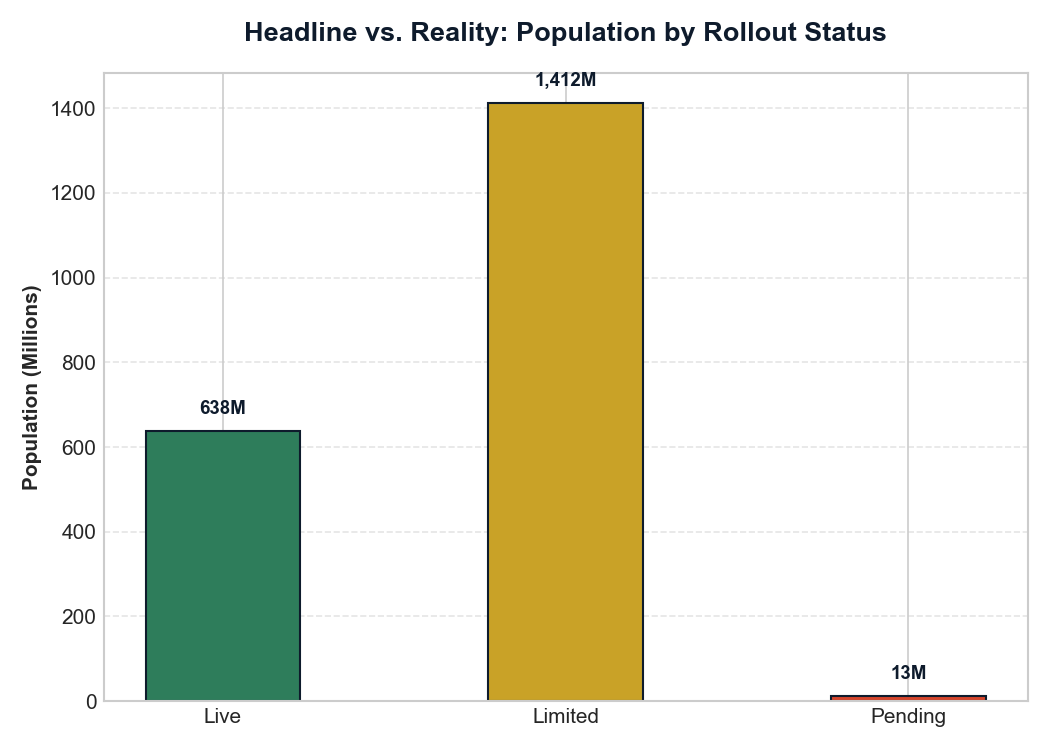
Splitting approved population by rollout status (live / limited / pending) cuts usable access to ~31% of the headline. China's data-compliance rules alone freeze two-thirds of the claimed reach.

The US is the leader and the bottleneck

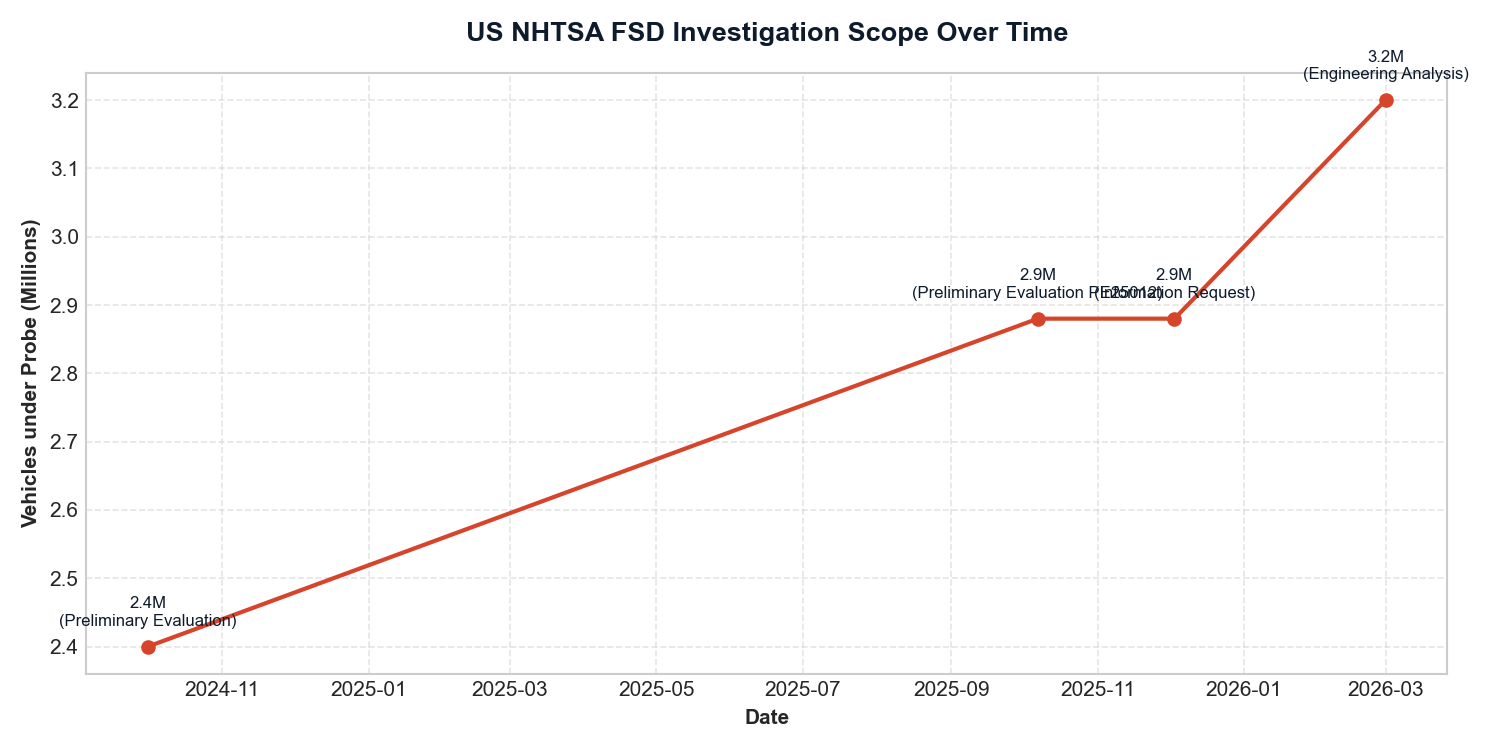
NHTSA escalated from a 2.4M-vehicle evaluation (2024) to a 3.2M-vehicle Engineering Analysis (2026) over camera-visibility failures and traffic-law violations — while Tesla could manually process only ~300 records a day of the regulator's data request.

The biggest markets have no rules at all

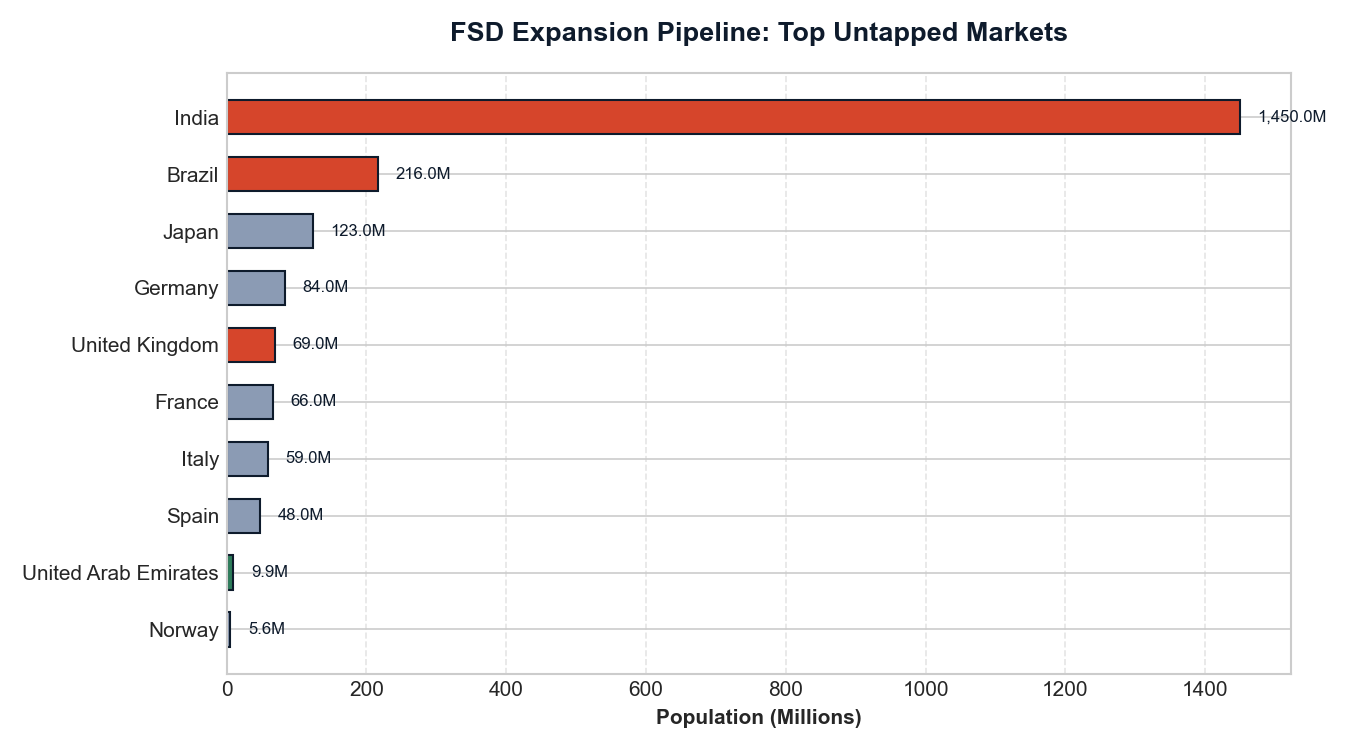
India (1.45B) and Brazil (216M) have no announced framework for supervised L2+ systems. The constraint there isn't approval — it's that there is nothing to approve against.

📍 Framework & Dimensions

Regional & Velocity Metrics Highlighted in This Project

To understand FSD adoption beyond raw numbers, I analyzed both regional differences and velocity metrics—two critical dimensions that Tesla strategy teams use internally to evaluate autonomy readiness.

Regional Metrics

Measuring how adoption, regulatory gates, and safety baselines differ across geographic boundaries.

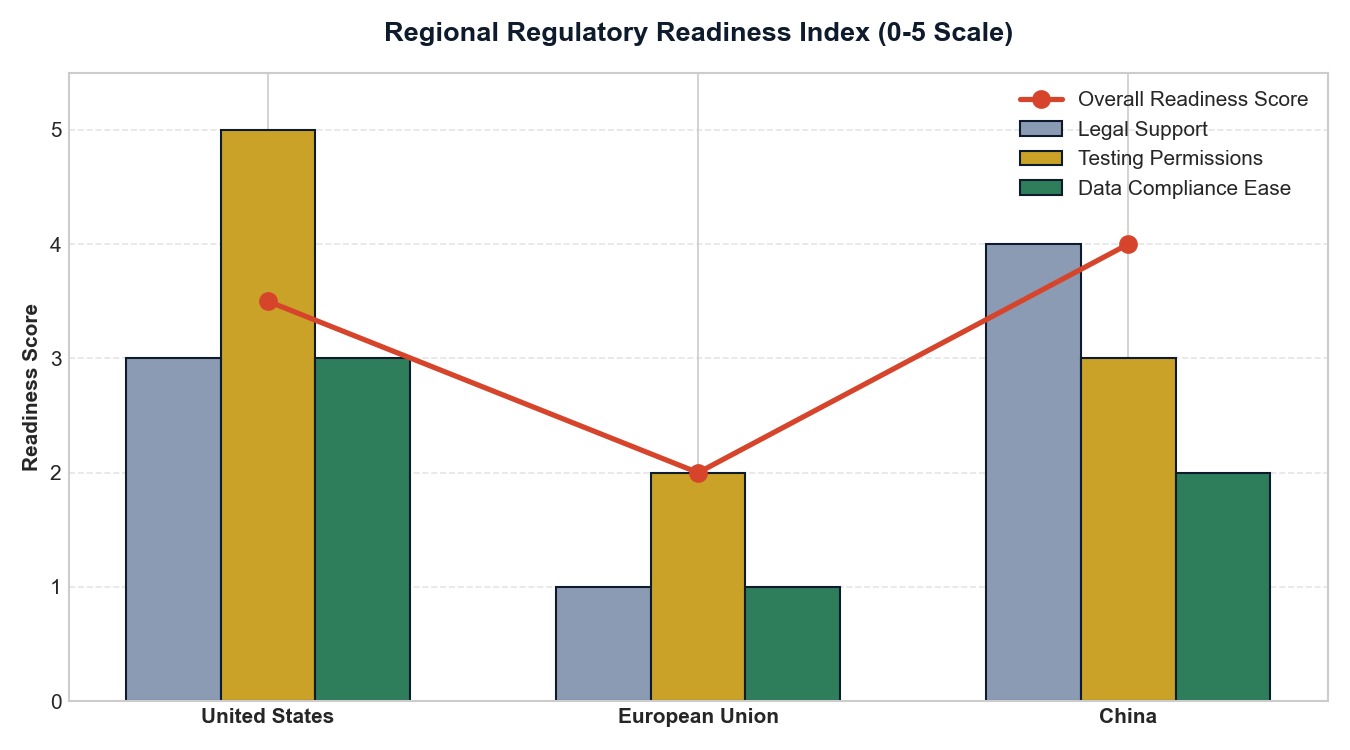
  • 🔒 Regulatory Readiness Score (0–5): Compares US (3.5), EU (2.0), and China (4.0) frameworks based on policy support, testing permissions, and data constraints.
  • 📊 Regional Adoption Mix: Highlighting regional differences (e.g., NA's Live rollout vs China's data compliance stall).
  • 🛡️ Localized Safety Signals: Analyzing empirical crash averages and interventions across jurisdictions.
  • 🌐 Infrastructure Readiness: Evaluating physical road quality, HD map constraints, and environmental variations.
  • 🤝 Consumer Trust Index: Mapping the gap between public perception and physical software capability.

Velocity Metrics

Measuring the speed of systemic change—how fast the software improves and how rapidly rules adapt.

  • 📈 Adoption Growth Velocity: Quarterly increases in subscriber take-rate over time.
  • ⚡ Safety Improvement Velocity: Safety gains (miles between crashes) as FSD versions mature.
  • ⏱️ Regulatory Progress Velocity: Collapse in approval latency (from 17 months down to 30 days in the 2026 EU wave).
  • 🔄 Software Release Cadence: Cycle times between major neural network releases (v12 → v12.3 → v14).
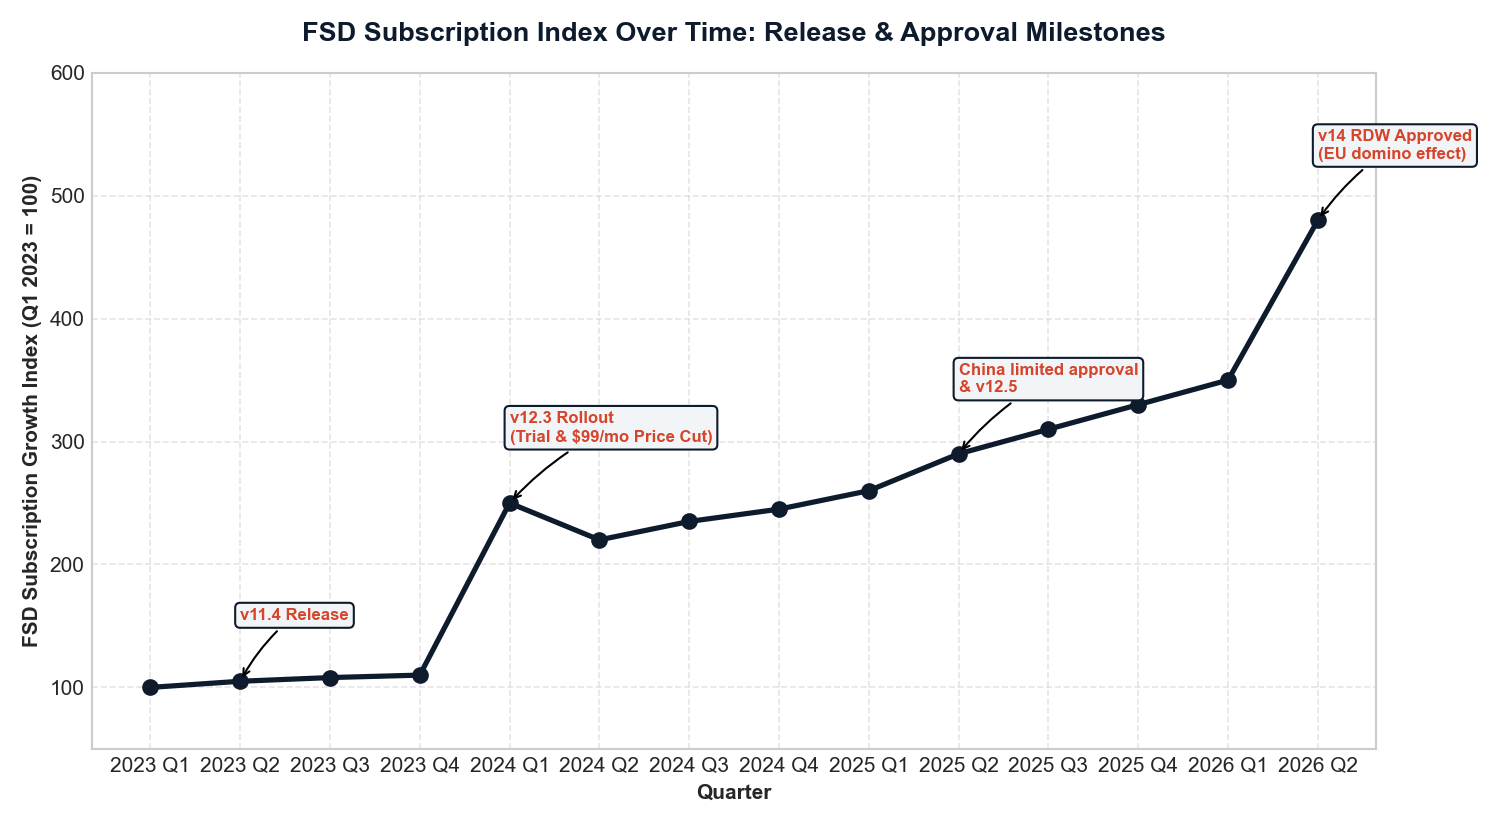
  • 🚀 Release-Driven Subscription Spikes: Measurable subscription growth immediately following major software release milestones.
"These metrics help reveal where FSD adoption is growing fastest, where it is most constrained, and how quickly the technology is improving."
Data Visualizations

The analysis in charts

Global Population with FSD Access (Cumulative)
Cumulative access step chart

Each country's approval adds to the cumulative population share. Note the 2026 European wave: five countries in ~60 days, showing that regulatory approvals behave like a network domino effect once a reference decision (Dutch RDW) is established.

Headline vs. Reality: Population by Rollout Status
Status breakdown bar chart

Live (green): Active rollout (639M people) · Limited (gold): China's restricted access (1.41B people) · Pending (red): Approved but not yet rolled out (13M people). The 25% headline overstates usable access by ~3x because two-thirds of the approved population is locked in China's data-compliance stall.

Approved FSD Population by Region & Status
Regional distribution stacked bar chart

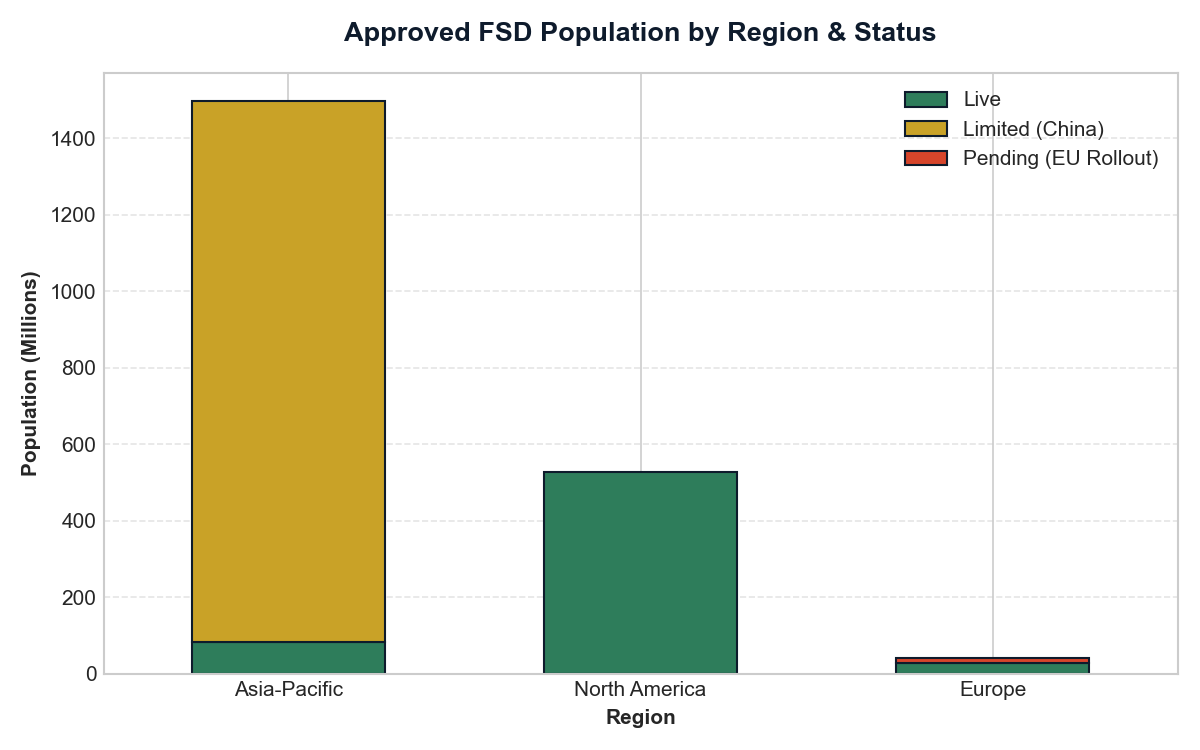
A regional breakdown shows how FSD availability is shaped by local laws. North America is almost fully live, Asia-Pacific is dominated by China's limited status, and Europe has approvals but remains mostly pending rollout.

Regional Regulatory Readiness Index (0-5 Scale)
Regional regulatory readiness score index chart

Quantifying readiness across regions on a 0-5 scale. China leads in policy support (4.0/5), the US leads in testing permissions (3.5/5), while the European Union remains the most restrictive (2.0/5) due to strict L2+ testing caps and GDPR data residency burdens.

US NHTSA FSD Investigation Scope Over Time
US NHTSA investigation scope growth

Investigation scope grew 33% from Oct 2024 (2.4M vehicles) to Mar 2026 (3.2M vehicles) — now in the Engineering Analysis phase, the formal step before a recall. Camera-only degradation under glare and debris remains the primary regulatory hazard in the US.

Safety Reality vs. Public Narrative: Crash Miles vs. Media Scrutiny
Safety Reality vs Public Narrative chart

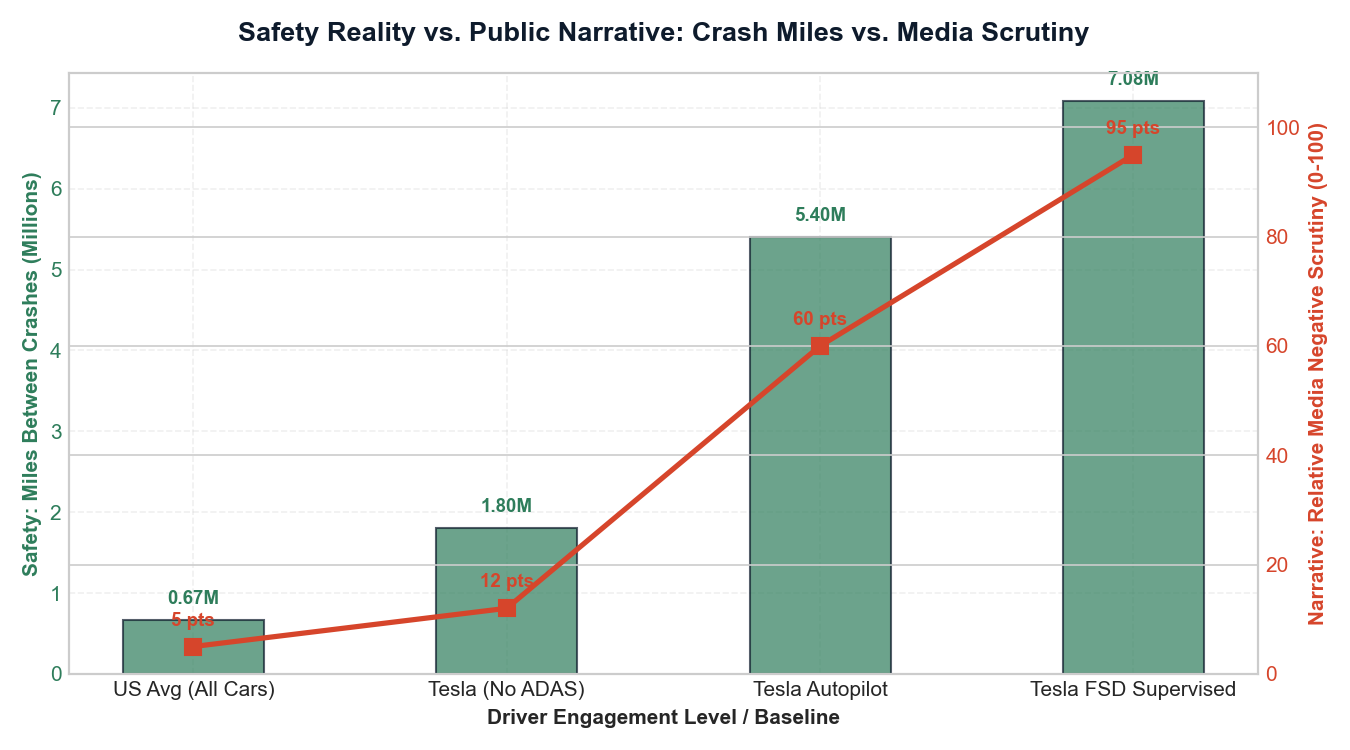
Comparing actual safety data (miles between crashes under FSD vs. US national average) against relative negative media narrative volume. Empirical safety shows FSD is 10.5x safer than the US average, but media scrutiny of FSD crashes remains extremely high (95 pts index). This reveals that the biggest barrier to adoption isn't capability — it's trust.

FSD Subscription Index Over Time: Key Release Milestones
FSD Subscription Index chart

Tracking the subscription index shows how software releases (such as v12.3 introducing end-to-end neural nets, accompanied by a 1-month free trial and a price cut to $99/mo) and regulatory approvals (such as the EU wave) drive massive adoption velocity.

FSD Expansion Pipeline: Top Untapped Markets
FSD expansion pipeline untapped markets chart

Combined, the untapped pipeline represents 2.2B people. India (1.45B) and Brazil (216M) represent the largest untapped populations but currently have no announced regulatory framework, highlighting that shaping local standards is the biggest scaling barrier.

Rollout Velocity by Year

Year Approvals Population Added
2020 1 349M
2022 1 42M
2025 6 1.63B
2026 (Q1–Q2) 5 40M

Insight: 2025 saw a massive jump (China + Mexico + Australia + 3 others in one year), but 2026 shows consolidation. Regulatory approval comes in waves, not linearly.

Pipeline: Top 10 Untapped Markets by Population

Country Population Status (Q2 2026) Key Blocker
India 1.45B Not announced No regulatory framework
Brazil 216M Not announced No announced framework
Japan 123M Pipeline 2026 Localization + approval
Germany 84M Pipeline EU type-approval pending
United Kingdom 69M Expected Awaiting regulator decision
France 66M Pipeline EU type-approval pending
Italy 59M Pipeline EU type-approval pending
Spain 48M Pipeline EU type-approval pending
UAE 9.9M Road testing Localized data collection
Norway 5.6M Pipeline High EV penetration; pending

Opportunity: Combined, the pipeline represents 2.2B people — nearly as large as the currently "approved" population. India alone is 3x the current US FSD user base.

Method

How I built it

Curated three datasets from primary public reporting (regulatory approval tracker, NHTSA investigation timeline, expansion pipeline), loaded them into SQLite, and wrote 8 SQL analyses — window functions for cumulative access and approval velocity, status splits for the headline-vs-reality gap. A reproducible Python script generates the processed tables and charts; Tableau Public hosts the interactive dashboard.

SQLite · window functions Python · pandas matplotlib Tableau Public NHTSA SGO / ODI records
Recommendations

What I'd tell the strategy team